What's new

OMG, it's soooo HOT!

Compaq

Been spending a lot of time on here!
Joined
Aug 29, 2010
Messages
3,400
Reaction score
657
Location
Norway
Can others edit my Photos
Photos OK to edit
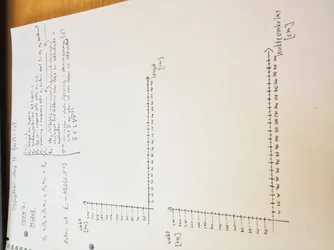
I made this on blank papers. Spent 15 minutes. I can't wait to fill in some points and evaluate my scatterplot! LOOOOL! Don't be fooled by the perspective, the angle is very close to 90 degrees.

$photo.webp
 
I expected something ... well ... slightly more hot :-P
 
BTW, do you by any Chance have relatives in Kautokeino in Norway? Want to go there for Easter, but the only hotel is booked now :/

Yes, I know, you live VERY far away from there ;)
 
Hehe, I do not, unfortunately. :) I've never been further north than Trondheim, and would love to visit Finnmarksvidda sometime. So many photo opportunities, and just many things to look at and experience! Get a lavvo and camp out ;)


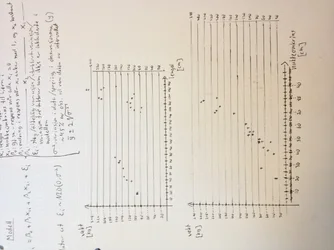
What would you estimate the regression coefficient to be in these two cases?
 

Attachments

  • $photo (1).webp
    $photo (1).webp
    264.6 KB · Views: 104
The bottom one looks pretty strong ... above 0.5? Or do you not know either & trying to get someone else to do your homework ;) ?
 
The first one seems to have two branches, there are apparently more effects influencing the result than just what is on the x and y axis. one of the branches is really good giving certainly a nice regression, almost better than the bottom one. You are lucky since in the top one both cases are so well separated. This is not data scattering, so just one regression coefficient for both branches gives no interpretable answer.
 
Oh, I'll be able to find it, I just haven't done the calculations yet :) This is one of the few exercises we need to do by hand, basically everything is done in R commander - it's an applied course.

The multiple regression model is as follows

y(i) = B0 + B1x1i + B2x2i,

where y is the weight (kg) of bear number i
x1 is the length (cm) of bear number i, and
x2 is the neck circumference (cm) of bear number i.

I'm making two scatterplots, one for each simple model (only one explanatory variable).
Now I'm to estimate the model parameters, and later compare the multiple regression model to the simple models, and evaluate which is the best. I'll also test the Betas and see if the explanatory variables explain anything at all.

 
Last edited:
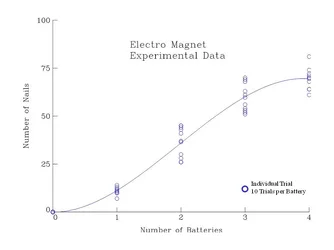
I can't resist, "Hot Plot". I used to write custom graphing software in the 1980s, for display of experimental data. All FORTRAN and Assembly, run under DOS. Also runs under XP or DOSBOX. I still use it for realtime data acquisition. Spline fitting, correlation (Pearson's "R" just popped into my head), Polynomial fit, down to turning pixels on by writing to addresses in screen memory. Output to an HP pen plotter, "HPGL". I found an HPGL to WMF convertor.

Input was simple Ascii "x,y" values.

My daughter used it for her 5th Grade Science Fair project a couple of years ago, which was 25 years after it was written.

HOT: we stopped at 4 batteries because the nail got VERY Hot.
 

Attachments

  • $plots.webp
    $plots.webp
    15 KB · Views: 94
Last edited:

Create an account or login to comment

You must be a member in order to leave a comment

Create account

Create an account on our community. It's easy!

Log in

Already have an account? Log in here.

Back
Top Bottom